| species | island | bill_length_mm | bill_depth_mm |
|---|---|---|---|
| Adelie | Torgersen | 39.1 | 18.7 |
| Adelie | Torgersen | 39.5 | 17.4 |
| Adelie | Torgersen | 40.3 | 18.0 |
| Adelie | Torgersen | NA | NA |
| Adelie | Torgersen | 36.7 | 19.3 |
| Adelie | Torgersen | 39.3 | 20.6 |
| Adelie | Torgersen | 38.9 | 17.8 |
| Adelie | Torgersen | 39.2 | 19.6 |
| Adelie | Torgersen | 34.1 | 18.1 |
| Adelie | Torgersen | 42.0 | 20.2 |
Hello, Penguins!
My final presentation
2023-04-28
Species
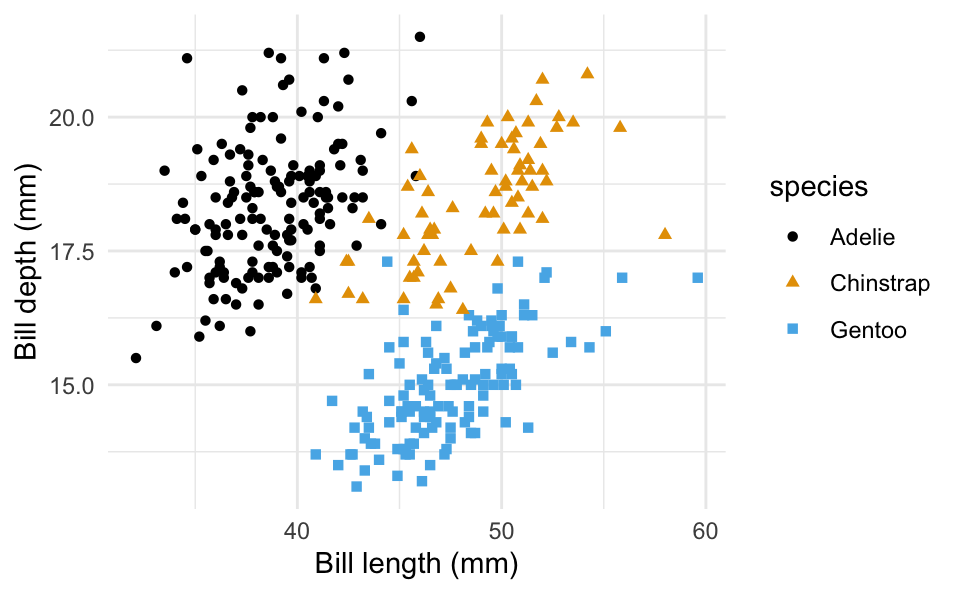
The figure below is a bar plot of species of penguins.
Model 2 results
Some text for column 1
Some more text for column 2
Some more text for column 3